Research Article
Flow Cytometry Analysis of DNA Ploidy and S-Phase Fraction in Salivary Gland Tumors of Egyptian Patients
Asmaa M Zahran1, Hussein Fakhry2*, Khaled A Hussein3, Mahmoud Abd El-Salam3, Mohamed A Mohamed3, Safaa M Tohamy4 and Ahmed M Hussein5
1Department of Clinical Pathology, Assiut University, Egypt
2Department of Surgical Oncology, Assiut University, Egypt
3Department of Oral and Dental Pathology, Al-Azhar University, Egypt
4Department of Oral Pathology, Minia University, Egypt
5Department of Oral and Maxillofacial Pathology, South Valley University, Egypt
*Corresponding author: Hussein Fakhry, Department of Surgical Oncology, Assiut University, Egypt
Published: 02 Jan, 2018
Cite this article as: Zahran AM, Fakhry H, Hussein KA, Abd
El-Salam M, Mohamed MA, Tohamy
SM, et al. Flow Cytometry Analysis
of DNA Ploidy and S-Phase Fraction
in Salivary Gland Tumors of Egyptian
Patients. Clin Oncol. 2018; 3: 1393.
Abstract
Aim: The aim of this study is to investigate the DNA ploidy and S-Phase Fraction (SPF) of some
Salivary Gland Tumors (SGTs) in Egyptian patients and to investigate the correlation between these
two biological parameters and the presumptive behavior of these neoplasms.
Methods: Flow cytometric analysis of DNA pliody and S-Phase Fraction (SPF) was done in 50 fresh
tumor tissue sections of SGTs which diagnosed as 15 benign and 35 malignant tumors.
Results: 93.3% of the benign SGTs tumors were diploid, while only 34% of malignant tumors were
diploid and 66% were aneuploid. The malignant SGTs had higher SPF than the benign tumors but
with no significant difference. There was no significant correlation of ploidy status or SPF with the
tumor grades of mucoepidermoid carcinomas.
Conclusion: DNA aneuploidy may be a key indicator for tumors activity and malignancy in SGTs,
while the SPF has a minor role in the evaluation of SGTs activity.
Keywords: Flow cytometry; Salivary gland neoplasm; Aneuploidy; Mitotic Index; Diploidy;
Mucoepidermoid carcinoma
Introduction
Salivary Glands Tumors (SGTs) are rare and represent 2-4% of head and neck neoplasm. The
global annual incidence for all SGTs as quoted by the World Health Organization (WHO), varied
from 0.4-13.5 cases per 100,000 populations [1]. They categorized into benign neoplasm, tumorlike
conditions, and malignant neoplasm [2]. Benign and malignant SGTs may resemble each other
grossly if seen early in their clinical course [3].
DNA analysis is an area of interest because chromosomal aberration is a characteristic feature of
neoplasia [4,5]. The clinical behavior of tumors may be assisted by flow cytometric analysis of DNA
content that allows rapid and reliable identification of cell with chromosomal aberrations that result
in a measurable deviation from the DNA content of the normal diploid cells [6]. The flow cytometry
allows a fast estimation of ploidy status and cell proliferation of the neoplasm by the determination
of nuclear DNA contents and provide 2 functional factors related to neoplastic progression, DNA
ploidy and the Synthesis Phase Fraction (SPF) [7,8].
DNA ploidy is a term used to describe the nuclear DNA contents. The deviation of DNA content
from the normal diploid value referred to as aneuploid, and it is widely accepted as an indicator
of malignancy in human tumors [9]. The detection of aneuploidy by flow cytometry may provide
practical informations on clinical behavior for SGTs [10]. DNA content analysis in SGTs had been
studied but with conflicting results. Some studies showed an overall low proportion of cases with
DNA aneuploidy [8,11]. Others, however, reported a high frequency of DNA aneuploidy in this type
of tumors [12]. Abnormal DNA content has been related to aggressive behavior in Mucoepidermoid
Carcinomas (MEC), Adenoid Cystic Carcinomas (AdCC), Acinic Cell Carcinomas (ACC) and
oncocytomas (Onc) [8]. S-phase value is correlated with the behavior of the tumors [13,14].
The aim of this study is to investigate the DNA ploidy and S-Phase Fraction (SPF) of some
Salivary Gland Tumors (SGTs) in Egyptian patients and to investigate
the correlation between these two biological parameters and the
presumptive behavior of these neoplasms.
Figure 1
Figure 1
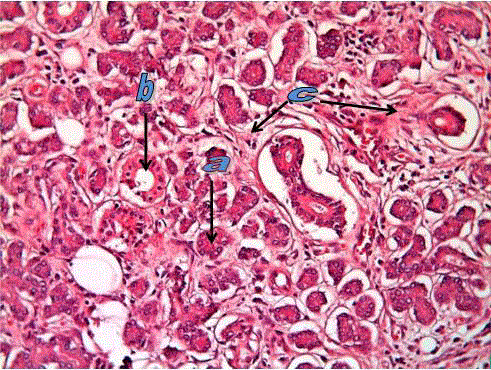
Normal submandibular salivary gland tissue showing serous acini
(a) and duct (b) in connective tissue stroma (c). (H&E. stain X200).
Figure 2
Figure 2
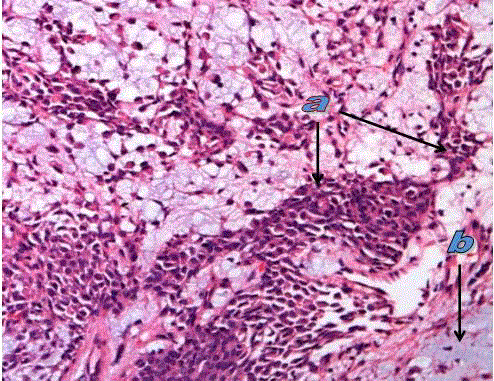
Pleomorphic adenoma in submandibular salivary gland showing
tumor cells (a) and myxoidcomponent (b). (H&E. stain X200).
Materials and Methods
Patients’ selection
The current study included fresh tissue of 50 patients presented
with SGTs which had been encountered in the last 4 years. Clinical
data and patients characteristics were retrieved from the clinical
charts. The diagnosis was 15 benign and 35 malignant SGTs. The
benign cases included 7 Pleomorphic Adenomas (PA), 5 Warthin
Tumors (WT) and 3 oncocytomas (Onc). The malignant cases
included 5AdCC, 3 Polymorphous Low Grade Adenocarcinoma
(PLGA), 3 ACC, 14 MEC, 3 Myoepithelial Carcinomas (MC) and
7 carcinoma ex-pleomorphic adenomas (CexPA). MEC included 7
high grade cases (grade III), 3 intermediate (grade II) and 4 low grade
(grade I).The tissue sections were collected after surgical resection at
the Department of Surgical Oncology, South Egypt Cancer Institute,
Assiut University and Oral and Maxillofacial Department, Faculty of
Dentistry, University of Alexandria.
The study was approved by Ethical Committee of Faculty of
Dental Medicine, Al-Azhar University, Assiut.
Surgery
For parotid glands tumors, we performed parotidectomy
(superficial or total) with an adequate margin of normal tissue with
preservation of the facial nerve unless it is directly infiltrated by
tumor. Regarding submandibular gland tumors, benign neoplasms
of the submandibular gland required complete excision of the gland
while, malignant neoplasms required submandibular triangle excision
without resection lingual and hypoglossal nerves unless it was directly
infiltrated by tumor to obtain clear margins. For minor salivary
glands tumors, we performed complete excision with adequate safety
margin. Selective or modified radical neck dissection was performed
in case of clinically or pathologically positive neck lymph nodes with
malignant SGTs.
Flow cytometry study
Three sections of 50 μm thickness from each tumor tissue were
cut and transferred to flow cytometry Unit, Clinical Pathology
Department, South Egypt Cancer Institute for flow cytometric
analysis of DNA ploidy and SPF. Single nuclear suspensions were
prepared by filtering through a 50-μm nylon mesh. The DNA
contents were measured in the suspensions using FACS Calibur
flow cytometer (Becton Dickinson Biosciences, San Jose, California
USA). DNA histograms of at least 50000 nuclei were analysed. The
DNA-diploid cell population of normal submandibular salivary
gland with retention cyst is used as a reference standard for the
identification of DNA-aneuploid clones. The percentages of the cell
cycle phases as well as the DNA indices of the aneuploid clones were
calculated using the Modfit software package. DNA histograms were
classified as diploid if there was a single G0-G1 peak and aneuploid if
additional G0-G1 peaks were present. The ratio of aneuploid G0-G1
peak values to diploid G0-G1 peak values was expressed as a DNA
index. All specimens had a G0-G1 peak coefficient of variation of
no more than 4%. The following were taken as cytometric variables:
DNA ploidy, DNA Index (DI), and SPF. The cases with DI between
0.95 and 1.05 were considered as DNA diploids, and those less than
0.95 (hypodiploid) or greater than 1.05 (hyperdiploid) as DNA
aneuploids. The SPF was estimated as percentage of cells occupying
the region between the mean channel number for G0/G1 and that
of G2/M, measured by the computer calculation program for DNA
analysis. The cut off for the SPF was set as the mean ± 2standard
deviation (SD) and considered as either being low or high. One
section from each block was cut at 5 μm thickness and stained with
Hematoxylin and Eosin (H&E) for confirmation of histopathological
diagnosis, classification, and assures that the tumor tissue constitutes
>70% of the paraffin section with minimal necrotic and hemorrhagic
foci. (Figure 1, 2)
Statistical analysis
Data was statistically described in terms of mean ± SD, median
and range, or frequencies (number of cases) and percentages when
appropriate. Comparison of numerical variables between the study
groups was done using Mann Whitney U test for independent
samples when comparing benign and malignant lesions and Kruskal
Wallis test when comparing MEC grades. For comparing categorical
data, Chi square (χ2) test was performed.
Results
The average age of patients in the current study was 45.8 years.
16 of 35 (47.7%) of patients with malignant tumors were between 30
and 60 years, while 60% of cases with benign tumors were above 60
years. The male to female ratio was 1.5:1 for benign and malignant
tumors. 28 tumors (56%) were originated in the parotid gland while 9
were originated in the submandibular gland (18%) and the remaining
(26%) were originated in the minor salivary glands.
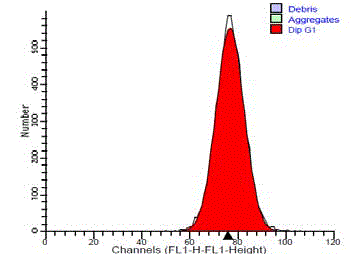
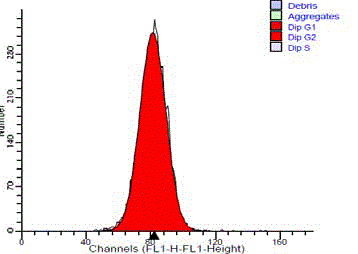
The normal standard of submandibular gland tissue showed a
single diploid G0/G1 peak. They showed no cells in the S-phase or
at G2/M peak (Figure 3). 14 cases (93.3%) of the benign tumors were
diploid and only one case was aneuploid, its diagnosis was WT. While
24 cases (66%) of malignant SGTs were aneuploid and 11 (34%) were
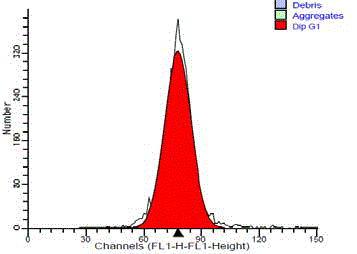
diploid. The diploid tumors showed a single diploid G0/G1peak
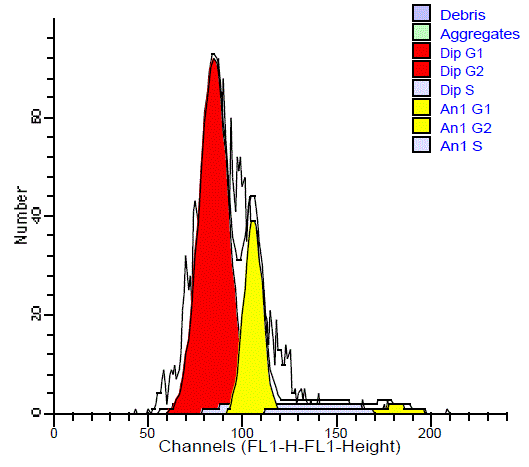
similar to that of the reference peak (Figure 4). In some cases G2/M
peak were also identified as a small peak that contained less than 15%
of whole cells.
The aneuploid tumors showed an additional peak with its
main channel. Aneuploid tumors were further classified into 23
hyperdiploid cases (22 malignant and 1 benign) and 2 hypodipliod.
In the hyperdiploid, the additional peak was to the right of G0/G1
diploid peak with DI ranged from 1.08 to 1.4 with a mean of 1.25
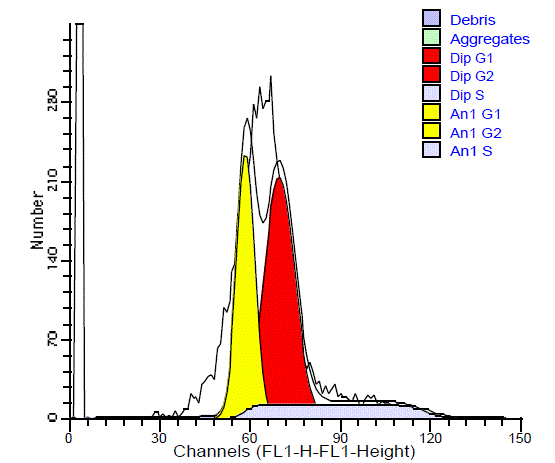
(Figure 5). The hypodiploid peak was to the left of G0/G1diploid
peak with DI ranged from 0.81 to 0.85 with a mean of 0.83 (Figure
6). The difference in the ploidy state (diploid and aneuploid DNA
pattern) between benign and malignant SGTs was statistically highly
significant (P = 0.001).
The SPF values of the diploid benign SGTs ranged between 1.7%
and 17.8% with a mean of 7.3%. For DNA diploid malignant SGTs,
SPF values ranged between 1.3% and 21.6% with a mean of 10.86%
and the SPF of the aneuploid malignant tumors ranged between 6.1%
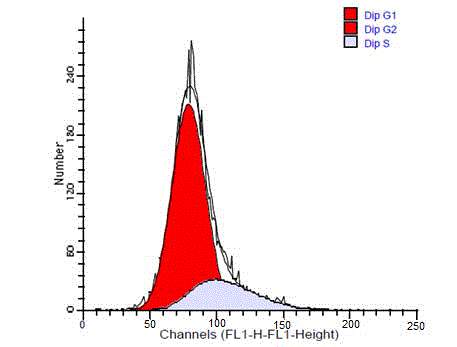
and 53.7% with a mean of 15.89%. 9 cases (64.28%) of the benign
tumors had low SPF (all had diploid DNA) (Figure 7), and 6 cases
(35.72%) had high SPF (2 diploid and 1 aneuploid). Among the
diploid malignant tumors 54.55% had high SPF and 45.45%had low
SPF. In the aneuploid malignant SGTs, about 79.16% had low SPF,
and 20.84% had high SPF (Figure 8). There is no significant difference
in the SPF between benign and malignant tumors (p= 0.528) and
between diploid and aneuploid tumors (p= 0.319). There was no
significant difference in the SPF between benign and malignant
tumors (p= 0.528) or between diploid and aneuploid tumors (p=
0.319).
Five cases of the 7 grade III MEC (71.4%), 2 cases of grade II
MEC and 2 cases of grade I had aneuploid DNA pattern. Four cases
of grade III and 2 of grade II MEC had high SPF while the remaining
had low SPF. The differences between grades in the ploidy states and
SPF were not statistically significant (P= 0.772). Also, none of the
clinical variables, patient's age, sex and tumor site had no correlation
with the ploidy status or SPF.
Figure 3
Figure 3
DNA frequency histogram of diploid standard (normal salivary
gland tissue), showing single G0/G1 peak and no SPF cells.
Figure 4
Figure 5
Figure 6
Figure 6
DNA frequency histogram of aneuploid malignant salivary gland
tumors showing hypodiploidy (DI= 0.81).
Figure 7
Figure 8
Discussion
Aneuploidy in the present Egyptian study was higher than that
reported by other researchers in SGTs [4,7,13]. This may be due to
late diagnosis of these tumors in our patients as most cases diagnosed
at advanced stage and the sections were taken from deep tumor
tissue to increase the number of tumor cells in our samples. The
deep samples demonstrated aneuploidy in the DNA content than
the superficial sample of the same tumor and correlated with atypical
histological and immunohistochemical features [15]. Agreement
with our results, Takashima [16] found that among the studied SGTs,
69% of malignant tumors were aneuploid. Pinto [8] performed flow
cytometric analysis on 97 SGTs, and found that all benign tumors
exhibited a DNA diploid pattern and 46.7% of high grade carcinomas
showed DNA aneuploidy. Also, Vargas [11] reported that all the PAs
were diploid and 44% of the high grade malignant lesions analyzed
were aneuploid. Monteiro [17] reported that 55% of malignant SGTs
had diploid DNA and 45% had aneuploidy DNA histograms. In the
present study, we had 5 cases of WT; one of them had aneuploid
DNA pattern which may be due to the aggressive behavior of WT
or the presence of malignant clones in the tumors section that was
analyzed by flow cytometry. This result was comparable with that of
Atula [18] who reported that 2 of 33 WTs showed clear aneuploid
DNA and seven cases were near diploid. The aneuploid WT in the
present study was a recurrent tumor with long duration. Martins [19]
mentioned that 4 of the 16 benign SGTs have aneuploidy pattern
with 3 of them being recurrent lesions. This indicates that the DNA
aneuploidy may contribute to the occurrence of recurrence and gains
further importance to the flow cytometric DNA analysis in predicting
the recurrence of SGTs.
The SPF represented a continuous variable related to any
proliferating cell population so it represented a biomarker of
malignancy. This study showed that malignant SGTs had higher
SPF than the benign SGTs but there was no significant difference.
Comparable results were obtained by a study of Kelsch [20] who
investigated 10 samples of PLGA that contain adequate tumor tissue
and found that all diploid tumors had S-phase percentage less than
those of the lowest aneuploid cell line but with no significant difference.
Nordgard [4] revealed that flow-cytometric analysis on fresh and
paraffin-embedded material of SGTs correlated well concerning DNA
ploidy, but not for the S-phase. Lin [21] noticed in their research on
ACC of the trachea and bronchus that aneuploidy tumors associated
with high SPF than diploid one but no variable marker could be
present as a prognostic indicator. Other studies found a statistically
significant difference in the SPF of benign versus malignant tumors,
diploid versus aneuploid tumors [7,8,22]. We found that there was no
significant correlation of ploidy status or SPF with the tumor grades
of MEC. This may be due to the few numbers of cases involved in
this study. This result was also observed by other investigators [8,13],
who reported that there was no significant relationship between
DNA ploidy status and histopathological grading. Other studies in
oral cancer [23,24] reported that there is no relationship between the
histopathological grade of oral epithelial dysplasia or oral squamous
cell carcinoma and the ploidy status. In contrast, two studies [25,26]
on ACCs reported an association between tumor grade and DNA
poidy. In the present study, the clinical data of patients (age, sex
and tumor site) didn't have any correlation with flow cytometric
parameters (ploidy status or SPF). These results are in agreement with
the previous study [11,17,27].
Conclusion
DNA aneuploidy may be a key indicator for tumor activity and malignancy in SGTs, while the SPF has a minor role in the evaluation of SGTs activity.
References
- Barnes L, Eveson J, Reichart P, Sidransky D. Tumors of the salivary glands. In: World Health Organization classification of tumors. Pathology and genetics of head and neck tumors. IARC. 2005.209-81.
- Chahin F, Kaufman R. Salivary gland tumors, minor, benign. E Medicine General Surgery. Cited in 2008. 1- 7.
- Vuhahula EA. Salivary gland tumors in Uganda: clinical pathological study. Afr Health Sci. 2004;4(1):15-23.
- Nordgard S, Franzen G, Boysen M, Tytor M. DNA analysis of malignant salivary gland carcinomas: comparison of different tissue preparations and measuring techniques. Acta Otolaryngol. 1999;119(4):510-5.
- Brenner JC, Chinnaiyan AM. Translocations in epithelial cancers. Biochem Biophys Acta. 2009;1796(2):201-15.
- Hemmer J, Hauser C. Chromosomal composition of aneuploid clones with different DNA contents in head and neck squamous cell carcinomas as determined by combined flow cytometry and fluorescence in situ hybridization. Anal Cell Pathol. 2000;20(4):197-203.
- Driemel O, Kraft K, Hemmer J. Flow cytometric S-phase fraction contributes to diagnosis of diploid malignant salivary gland tumors. Int J Oral Maxillofac Surg. 2006;35(10):947-50.
- Pinto AE, Fonseca I, Soares J. The clinical relevance of ploidy and S-phase fraction determination in salivary gland tumors, a flow cytometric study of 97 cases. Cancer. 1999;85(2):273-81.
- Duesberg P, Rasnick D, Li R, Winters L, Rausch C, Hehlmann R. How aneuploidy may cause cancer and genetic instability. Anticancer Res. 1999;19(6A):4887-906.
- Hedley D, Friedlander M, Taylor J, Rugg C, Musgrove E. Method for analysis of cellular DNA content of paraffin embedded pathological material using flow cytometry. J Histochem Cytochem. 1993;31(11):1333-5.
- Vargas PA, Torres-Rendon A, Speight PM. DNA ploidy analysis in salivary gland tumors by image cytometry. J Oral Pathol Med. 2007;36(6):371-76.
- Tytor M, Gemryd P, Wingren S, Grenko RT, Lundgren J, Lundquist PG et al. Heterogeneity of salivary gland tumors studied by flow cytometry. Head Neck. 1993;15(6):514-21.
- Driemel O, Maier H, Kraft K, Haase S, Hemmer J. Flow cytometric DNA ploidy in salivary gland tumors. Oncol Rep. 2005;13(1):161-5.
- Gemryd P, Lundquist PG, Tytor M, Hellquist HB, Nordenskjold B. Prognostic significance of DNA ploidy in mucoepidermoid carcinoma. Eur Arch Otorhinolaryngol. 1997;254(4):180-5.
- Gallego L, Junquera L, Hernando J, Fresno MF, Salas A, Cutilli T. DNA aneuploidy as a topographic malignant transformation pattern in a pleomorphic adenoma of long term evolution: a case report. J Med Case Rep. 2011;4:541-5.
- Takashima S, Sone S, Horii A, Okamoto S, Yoshida J. Major salivary gland lesions: correlation of MR findings with flow cytometric DNA analysis and prognosis. Am J Roentgenol. 1996;167(5):1297-304.
- Monteiro LS, Palmeira C, Bento MJ, Lopes C. DNA content in malignant salivary gland tumors. Oral Dis. 2009;15(4):295-301.
- Atula T, Grenman R, Laippala P, Klemi PJ. Aneuploidy in salivary gland adenomas. Eur Arch Otorhinolaryngol. 1995;252(7):395-400.
- Martins C, Fonseca I, Felix A, Roque L, Soares J. Benign salivary gland tumors: a cytogenetic study of 21 cases. J Surg Oncol. 1995;60(4):232-7.
- Kelsch RD, Bhuiya T, Fuchs A, Gentile P, Kahn MA, Fantasia JE. Polymorphous low grade adenocarcinoma flow cytometric, p53, and PCNA analysis. Oral Surg Oral Med Oral Pathol Oral Radiol Endod. 1997;84(4):391-9.
- Lin CM, Li AF, Wu LH, Wu YC, Lin FC, Wang LS. Adenoid cystic carcinoma of the trachea and bronchus: a clinicopathological study with DNA flow cytometric analysis and oncogene expression. Eur J Cardiothorac Surge. 2002;22(4):621-5.
- Horii A, Yoshida J, Sakai M, Okamoto S, Kubo T. Flow cytometric analysis of DNA content and Ki-67-positive fractions in the diagnosis of salivary gland tumors. Eur Arch Otorhinolaryngol. 1998;255(5):265- 8.
- Torres-Rendon A, Stewart R, Craig GT, Wells M, Speight PM. DNA ploidy analysis by image cytometry helps to identify oral epithelial dysplasias with a high risk of malignant progression. Oral Oncology. 2009;45(6):468-73.
- Franzen G, Nordgard S, Boysen M, Larsen PL, Halvorsen TB, Clausen OP. DNA content in adenoid cystic carcinoma. Head Neck. 1995;17(1):49-55.
- Franzen G, Klausen OG, Grenko RT, Carstensen J, Nordenskjold B. Adenoid cystic carcinoma: DNA as a prognostic indicator. Laryngoscope. 1991;101(6):669-73.
- Enamorado I, Lakhani R, Korkmaz H, Yoo GH, Del Mar Alonso M, Pietraszkiewicz H et al. Correlation of histopathological variants, cellular DNA content, and clinical outcome in adenoid cystic carcinoma of the salivary glands. Otolaryngol Head Neck Surg. 2004;131(5):646-50.
- El-Deftar MF, El-Gerzawi SM, Abdel-Azim AA, Tohamy SM. Prognostic significance of ploidy and S-phase fraction in primary intraoral squamous cell carcinoma and their corresponding metastatic lymph nodes. J Egy Nat Cancer Inst. 2012;24(1):7-14.

