Original Research
Comparative Expression Analysis Reveals Relationships between SPINK1, TUBB3, and EZH2, and Prostate Cancer Molecular Biomarkers in the Cancer Genome Atlas (TCGA) Data
Carolina Saldana1,2, Myriam Kossai3, Guillaume Ploussard4,5, Salem Chouaib6 and Stéphane Terry6*
1Department of Medical Oncology, Henri Mondor Hospital (AP-HP), France
2University of Paris-Est, France
3Department of Pathology, Gustave Roussy Cancer Campus, France
4University Institute of Cancer Toulouse Oncopole, France
5Department of Urology, Clinique Saint Jean Languedoc, France
6INSERM U1186, Gustave Roussy Cancer Campus, France
*Corresponding author: Stéphane Terry, INSERM U1186, Team Labeled For The League Against Cancer, Gustave Roussy Cancer Campus, 114 Rue Edouard Vaillant, 94800 Villejuif, France
Published: 21 Oct, 2016
Cite this article as: Saldana C, Kossai M, Ploussard G,
Chouaib S, Terry S. Comparative
Expression Analysis Reveals
Relationships between SPINK1,
TUBB3, and EZH2, and Prostate
Cancer Molecular Biomarkers in the
Cancer Genome Atlas (TCGA) Data.
Clin Oncol. 2016; 1: 1128.
Abstract
Background: Despite the recent discovery of molecular subtypes in prostate cancer (PCa) expressing
or not gene fusions involving E26 Transformation-Specific (ETS) transcription factors, including
ERG (for v-ets avian erythroblastosis virus E26 oncogene homolog), little is known on molecular
alterations associated, and cooperative events at play during initiation and progression of PCa.
Objective and methods: Using RNA-Seq data from The Cancer Genome Atlas (TCGA) collection of
surgically managed primary prostate adenocarcinomas, we investigated the relations between gene
expression of the candidate prognostic markers SPINK1, TUBB3 (class III beta-tubulin), EZH2, and
known PCa molecular markers. 484 cases were included in the analysis.
Results: Clustering analysis consistently showed TUBB3 associating with EZH2, and SPINK1 with
PTEN and TFF3, but not with ERG, ETV1, CHD1, AR or SPOP expression. Positive and negative
correlations were found among these PCa markers. Notably, in tumors highly expressing SPINK1
or TUBB3, a subset of cases showed substantial EZH2 expression, while EZH2 expression was
highly correlated with AURKA expression (r=0.7178; p <0.0001), an oncogenic target in cancer.
Interestingly, we found that high expression of EZH2 was strongly associated with reduced SPOP
expression (r=-0,455; p <0.0001). Moreover, tumors expressing SPINK1 and TUBB3 often appeared
to have reduced expression of RB1, AR, and REST as possible signs of neuroendocrine differentiation.
Conclusions: Despite substantial heterogeneity among the PCa cases, the current study suggests
that significant associations and overlaps exist between PCa molecular alterations and expression of
candidate PCa prognostic markers. A better understanding of these alterations and their cooperative
role should help refine PCa subtypes, identify aggressive subgroups among those, and improve PCa
management and therapy response.
Introduction
Prostate cancer (PCa), as many other cancers, is characterized by extensive clinical and
molecular heterogeneity [1]. Over the past 10 years, with the advent of high throughout methods,
our understanding of the PCa genome has significantly changed, while revealing considerable intertumor
(between tumors of the same type), and intra-tumor (within tumors, different subclones)
heterogeneities [2-8]. Based on the molecular alterations identified, different molecular PCa
subclasses or subtypes have emerged with the attempt to correlate those PCa subtypes to clinical
features, disease progression and response to therapy. Approximately 50% of PCAs harbor a gene
fusion between ERG, an ETS transcription factor, and an androgen-regulated gene (TMPRSS2 ~
90%, SLC45A3, NDRG1, HERPUD1, or others <10%) [9,10]. ERG expression is routinely used as
a surrogate marker of these alterations [11]. Trefoil factor 3 (TFF3) represents a highly specific
molecular biomarker of cancer in the prostate. Detectable in 40%
to 60% of PCa cases [12,13], it appeared to be inversely correlated
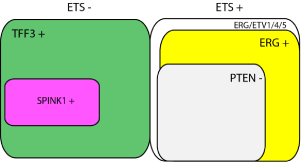
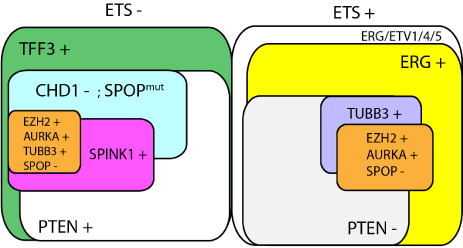
with ERG expression in most instances [14] (Figure 1). Inactivation
of tumor suppressor phosphatase and tensin homolog (PTEN)
is also commonly found in PCa and could be associated with
cancer progression [15,16]. Several studies have found that PTEN
alterations are enriched in ERG-over expressing PCa. Moreover, ERG
overexpression and alterations of PTEN could cooperate, leading to
more aggressive disease [17,18]. Despite these significant advances, it
remains a challenge to link this molecular classification with clinical
features to improve prognostic estimation, and treatment decisions in
routine clinical practice [12,13,19-27].
SPINK1 (previously referred to as TATI, or tumor-associated
trypsin inhibitor) is expressed in various diseases including cancer
[28]. Tomlins et al. [29] identified SPINK1 as a candidate marker for
a group of PCa devoid of ETS gene fusions associated with aggressive
disease features and adverse outcomes. In other studies, a correlation
between SPINK1 expression and adverse prognosis was not observed
[25,30,31]. Nevertheless, in a recent survey, the prognostic value of
SPINK1 was confirmed in a well-annotated cohort [14]. We proposed
that SPINK1 overexpression emerges from a subgroup of PCa with
ERG negative/TFF3 (trefoil factor 3) positive pattern [14] (Figure 1).
It is to note that various experimental studies have shown that
ERG, TFF3 and SPINK1 are all associated with increased cell motility
and/or invasive behavior in PCa models supporting their role in PCa
progression [29,32,33].
Elevated βIII-tubulin (encoded from TUBB3 gene) expression
was previously identified as significantly associated with tumor
aggressiveness in PCa patients with presumed localized disease [34].
In this study, βIII-tubulin expression was found to be an independent
marker of disease recurrence after local treatment. Recently,
Tsourlakis and colleagues examined a large European cohort and
confirmed this finding [35]. Additionally, increased βIII-tubulin
expression is associated with the emergence of Castrate Resistant
PCa (CRPC) [36,37], and with lower survival for patients receiving
docetaxel-based chemotherapy [34].
The polycomb group protein enhancer of zeste homolog 2 (EZH2)
is known to be increased in metastatic PCas. Clinically localized PCa
that express elevated levels of EZH2 show a poorer prognosis [38],
suggesting that EZH2 has a potential role in disease progression
and patient prognosis [39-41]. Moreover EZH2 expression is found
elevated in Neuroendocrine PCa, a higly aggressive form of human
PCa [42,43]. In the era of precision medicine [44,45], these findings
underscore the potential utility of decrypting the relationships at play
between SPINK1, TUBB3, EZH2 expression and other PCa molecular
alterations in order to improve our definition of molecular PCa
subclasses and find best therapeutic solutions for the management
of patients.
In the present work, we examined publically available gene
expression data from primary PCa cases of The Cancer Genome
Atlas (TCGA), and studied relationships between gene expression
of TUBB3, SPINK1, EZH2 and expression of other known molecular
PCa biomarkers including ERG, ETV1, PTEN, CHD1, TFF3, MYC,
RB1, MYC, AURKA, and SPOP [2,3,6,7,42, 46-49].
Figure 1
Figure 1
Schematic representation of the PCa molecular subtypes deriving
from previous studies. Tumors without or with ETS fusions are shown on
the left and right, respectively. In the ETS positive tumors, the vast majority
harbor genomic rearrangements leading to ERG overexpression, thus
representing an ERG positive PCa subtype. PTEN loss is commonly found
in this subtype. ETS negative PCas generally express TFF3 as a molecular
cancer biomarker, and a subgroup of these PCas express SPINK1. This
subgroup may reflect a subset of disease with more aggressive behavior.
Methods
RNA-Seq gene expression analysis, clustering and
statistical analysis
Human samples analyzed consisted of primary of prostate
adenocarcinomas from The Cancer Genome Atlas (TCGA) project
collection (http://cancergenome.nih.gov/). TCGA RNA-Seq
expression data and sample information were accessed before June
2016 from cBioPortal [50] and the TCGA public access data (http://
tcga-data.nci.nih.gov/). Only cases with available expression data,
and analyzed for mutational landscape were considered. The cohort
consisted of men surgically managed for localized or locally advanced
disease. Of note, about 16% (41 of 260 cases; NA for the remaining
cases) also received adjuvant treatments consisting of hormone
therapy, radiotherapy, or a combination of those. Available patient
cohort characteristics are shown in Table 1 (n=484).
To explore expression levels and associations of the different
genes, gene expression levels (RSEM) were subjected to correlation
and unsupervised clustering analyses using Cluster and TreeView
softwares after transforming the RSEM into Log2 (RSEM+1). Genes
analyzed included ERG, ETV1, PTEN, CHD1, TFF3, MYC, SPOP,
SPINK1, EZH2, TUBB3, RB1, and AURKA. Pearson's coefficient
was determined to assess correlations between expression levels.
For differential expression analysis, an unpaired t test or a nonparametric
Mann-Whitney U test was applied as appropriate. All
p values were two-sided and values of p <0.05 were considered
statistically significant.
Table 1
Figure 2
Figure 2
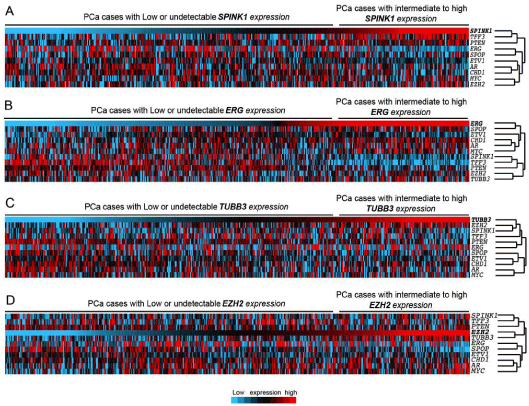
Hierarchical cluster analysis and heatmap generated using SPINK1, ERG, TFF3, ETV1, AR, CHD1, PTEN, SPOP, ERG, and EZH2 expressions across TCGA prostate adenocarcinomas (n=484). In the heatmap, each column represents a different case, and each row represents a marker. blue to red: lowest to
highest expression. PCa cases are ordered with respect to expression of SPINK1 (A), ERG (B), TUBB3 (C), or EZH2 (D).
Results
In the group of ETS negative PCa, SPINK1 expression is positively correlated with TFF3 and PTEN expression
levels
Expression data were retrieved from TCGA collection, tumor
samples ordered by SPINK1 expression, and clustering analysis
was performed for gene expression of PCa molecular biomarkers
including ERG, TFF3, ETV1, AR, CHD1, PTEN, SPOP, ERG, and
EZH2 (Figure 2a). Expectedly, SPINK1 expression clustered with
TFF3 expression, and seems inversely correlated with ERG and ETV1
expression. SPINK1 and TFF3 also clustered with PTEN expression.
PTEN expression appeared to be especially elevated in a number of
cases expressing high levels of SPINK1. By contrast, it was reduced
in the cases expressing high levels of ERG, as also evidenced by
an additional heatmap with tumor classified with respect to ERG
expression (Figure 2b).
To substantiate these results, we computed correlation scores
between SPINK1 expression and each molecular marker (Table 2).
SPINK1 and TFF3 were significantly correlated (r=0.36, p <0.0001)
and both inversely correlated with ERG, CHD1, and AR (Table
2). Moreover, ERG negatively correlated with PTEN (r=-0.2911;
p <0.0001). This likely reflects an enrichment of PTEN deletion in
ERG+PCa subtype as described previously [17,51,52].
A subset of tumors expressing SPINK1 concomitantly
expresses high levels of EZH2
Interestingly, we also noted in the heatmap a relative enrichment
of EZH2 expression in tumors expressing high levels of SPINK1
(Figure 2a), and based on the correlation analysis, EZH2 expression
was positively correlated with SPINK1 expression (r=0.1554,
p=0.0006). This data suggests that at least a subset of SPINK1
expressing tumors also expresses high levels of EZH2. Importantly,
there was however no correlation between EZH2 and TFF3 (Table
2), neither with ERG. We previously described the presence of
SPINK1 expression characterizes an aggressive subtype in the group
of ERG-/TFF3+PCa tumors [14]. Our observation here suggests
that EZH2 overexpression preferentially arises from ERG-/TFF3+/
SPINK1+PCas rather than in ERG-/TFF3+/SPINK1-PCas, which
could coincide with more aggressive forms of the disease.
A subset of tumors expressing TUBB3 concomitantly
expresses high levels of EZH2
We then investigated how these markers could cluster with
TUBB3 (encoding for Class III β-tubulin), another candidate marker
for aggressive PCa disease [34], also assumed to be an early marker
for reduced AR signaling [36] and NE differentiation [37,53]. A
Heatmap of the same set of genes in tumors classified by TUBB3
expression revealed a marked enrichment of EZH2 in tumors
overexpressing TUBB3 (Figure 2c), further highlighted by a positive
correlation coefficient (r=0.32; p <0001; Table 2). The analysis also
revealed TUBB3 and PTEN expression patterns inversely correlated
(r=-0.3159; p <0001), with AR and SPOP also following this trend
(r=-0.26 and -0.20, respectively; p<0001). Intriguingly, SPINK1
expression did not appear to be associated with TUBB3 expression.
SPINK1 expression was correlated with PTEN expression, when
TUBB3 expression anticorrelated with PTEN expression. Moreover,
TUBB3 expression seemed to be more closely associated with EZH2
than SPINK1. This indicates that SPINK1 or TUBB3 expressions may
be mutually exclusive under some circumstances; thus representing
two distinct subsets of disease. Another possibility might be that
a large proportion of TUBB3 expressing tumors is confined to the
ERG+ / PTENlow PCa subtype, that is negative for SPINK1, while a
smaller fraction is linked to ETS–TFF3+SPINK1 PCa subtype, and
both can exhibit an enriched expression of EZH2.
EZH2 expression is associated with AURKA expression
and SPOP alterations
We then generated a heatmap classifying tumors with respect
to EZH2 expression (Figure 2d), in conjunction with correlation
analysis. This denoted a striking positive correlation between EZH2
and AURKA levels (r=0.7178; p <0.0001), and an inverse correlation
between EZH2 and SPOP levels (r=-0.455; p <0001; Table 2). The
connection between EZH2 expression and downregulated levels of
SPOP is intriguing, especially considering recent work by Barbieri
and colleagues who identified inactivating mutation in SPOP gene
as the most common point mutation in PCa [6]. Further work by
this group revealed that this mutation occurs predominantly in the
group of ERG rearranged PCa tumors [6], and is concomitant with
deletions at 5q21 CDH1 locus [47]. We then sought to determine
whether mutation in SPOP gene, is associated with varying levels of
SPINK1, EZH2 and TUBB3 (Figure 3). When considering all patients,
SPOP mutant cases had elevated expression of EZH2, SPINK1 and
TFF3, but reduction in expression of ERG and CHD1. There were no
significant changes noted for TUBB3 and SPOP expression levels.
SPINK1, TUBB3 and EZH2 are associated with various NE
features
Previous studies have reported associations of TUBB3 and
EZH2 overexpression with aggressive features in localized PCa, or
NE features in castrate resistant CRPC tumors [34-36,42]. We asked
weather SPINK1, TUBB3, EZH2 could also associate with NE features
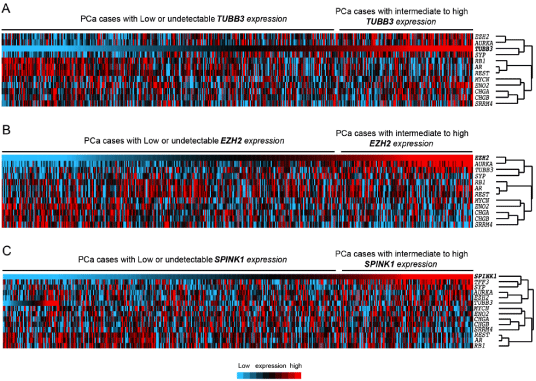
in this cohort of locally managed PCa tumors. Heatmaps were
generated with respect to TUBB3, EZH2, or SPINK1 expression, and
their distribution was studied as above among a panel of NE markers,
putative drivers and suppressors of NE phenotype, (NE suppressors
(RB1, REST, AR); NE drivers (AURKA, SRRM4, MYCN); NE markers
(SYP (synpatophysin), ENO2 (NSE), CHGA (chromogranin A),
CHGB (chromogranin B)) (Figure 4). Correlation coefficients
were determined as above to assess associations between variables.
Notably, EZH2 highly correlated with AURKA gene expression, but
with the exception of TUBB3, showed no or negative correlation with
other NE components. By contrast, tumors with high expression of
TUBB3, and SPINK1 to a lesser extent, more frequently exhibited NE
features, as judged by anti-correlations with REST, AR and RB1, and
positive correlation with SYP (Table 3).
Table 2
Figure 3
Figure 3
The effect of SPOP mutation on expression of SPINK1, TFF3, ERG, TUBB3, EZH2, CHD1, PTEN, and SPOP accross 484 PCa samples. Box plots
showing the Median, 25th to 75th percentiles. Lower and upper bars correspond to the minimum and maximum values, respectively.
Table 3
Figure 4
Figure 4
Hierarchical cluster analysis and heatmap generated using expression levels of SPINK1, TUBB3, EZH2, and NE components AR, SYP, RB1, CHGA, CHGB, ENO2, MYCN, AURKA, REST, SRRM4 across TCGA prostate adenocarcinomas (n=484). In the heatmap, each column represents a different case, and
each row represents a marker. blue to red: lowest to highest expression. PCa cases are ordered with respect to expression of TUBB3 (A), EZH2 (B), or SPINK1 (C).
Discussion
We previously proposed SPINK1 and βIII-tubulin expressions as
independent prognosticators of disease recurrence in PCa patients
primarily managed by prostatectomy [14,34]. Together with EZH2,
another potential marker of PCa aggressiveness, these genes may be
directly involved in progression, metastatic spread and/or therapy
resistance of PCa. One interesting open question regarding these
genes is to what extent these genes cooperate or overlap with other
known molecular alterations recently characterized in PCa and
defining PCa subclasses [1-3,6,7,42,46-49, 54].
In this work, by exploring RNAseq data from the TCGA prostate
adenocarciomas, we confirmed on a large series of primary PCas
that SPINK1 positive tumors represent a molecular subgroup of PCa
tumors strongly associated with TFF3 expression, and correlating
negatively with ERG expression. We found that these tumors express
PTEN more often, but less CHD1 or AR. Importantly, a subset of those
cases seem to overexpress EZH2. Tumors highly expressing TUBB3
also frequently exhibited higher expression of EZH2. Correlation
analyses also revealed that EZH2 expression was positively associated
with AURKA expression, an oncogenic target in cancer, while it was
negatively associated with SPOP expression, a new putative tumor
suppressor in PCa that is frequently mutated [1,6,23]. It is tempting
to speculate that a molecular link exists between SPOP alterations,
EZH2 and AURKA expression. In line with this possibility, our
preliminary data already indicate, that in the group of SPINK1 high
expressing PCa cases, SPOP mutants displayed higher expression of
EZH2 and AURKA compared to SPOP wild-type (data not shown).
Altogether these findings should help refine PCa molecular
subtypes, and identify subgroups of aggressive PCa. A working model
of the different subgroups is presented in Figure 5.
It remains unclear however weather SPOP alterations influences
the group of TUBB3 high PCa. Aside from the apparent relations
between TUBB3, EZH2 and AURKA, SPOP expression was only
slightly reduced in TUBB3 high PCa, and we did not find relationship
between TUBB3 expression and SPOP mutation status. We posit
that in the groups of SPINK1 high or TUBB3 high PCa tumors, also
characterized by high vs. low expression of PTEN, respectively, a
subset of cases express significant levels of EZH2 accompanied by
substantial AURKA expression which could evoke more aggressive
features. A thorough assessment of such hypotheses will require
further investigations on independent cohorts, and validation by
various techniques including Fluorescence in Situ Hybridization
(FISH) and immunohistochemistry-based approaches. Our data
investigating NE features in this series indicates that EZH2 is not
directly associated with NE differentiation in this disease stage. Hence,
EZH2 is unlikely to be a driver of NE differentiation in primary tumors.
However, its concurrent expression with SPINK1 or TUBB3 in some
circumstances could be linked to the emergence of NE features. Of
therapeutic relevance, many inhibitors directed against AURKA and
EZH2 has been developed these recent years [55-57]. Thus, if this
hypothesis is confirmed, this could provide a biological rationale for
testing the effect of such new-targeted therapies to treat these PCa
subgroups. In addition, because EZH2 and/or AURKA upregulation
might represent two key events during the transformation of prostate
adenocarcinoma towards Neuroendocrine PCa [42,43,58], one could
consider targeting these components at an early stage in order to
prevent NEPC development and its progression [43,59].
Figure 5
Figure 5
Schematic representation of the PCa molecular subgroups
deriving from this study and from previous studies. Tumors without or with
ETS fusions are shown on the left and right, respectively. In the ERG positive
PCa subtype, PTEN loss is a commonly found, while it is relatively rare in
ETS negative (TFF3+) subtype in which reduction of CHD1 and inactivating
mutations in SPOP become more common features. In each PCa subtype,
other alterations such as TUBB3, SPINK1, or EZH2 overexpression working
in parallel or together (likely in association with additional related events
such as AURKA upregulation and SPOP downregulation) may characterize
subsets of disease with more aggressive behavior, resistant to therapies,
or being able to proliferate or progress more rapidly to metastatic disease.
Other important alterations, that are not shown here, are likely involved in
initiation, progression, or differentiation of the disease. This includes, but not
only, MYC amplification, ETV1 amplification/overexpression; mutations in
TP53, CTNNB1, ATM, BRCA2, or FOXA1; deletion or reduction of NKX3.1,
RB1, AR, REST.
Acknowledgments
We are thankful to many colleagues for continuous encouraging discussions and give particular thanks to Yves Allory, Francis Vacherot, Christophe Tournigand, Alexandre de la Taille, and Nathalie Nicolaiew. We apologize to the authors whose work could not be cited. We declare no competing financial interests.
References
- Shoag J, Barbieri CE. Clinical variability and molecular heterogeneity in prostate cancer. Asian J Androl. 2016; 18: 543-548.
- Taylor BS, Schultz N, Hieronymus H, Gopalan A, Xiao Y, Carver BS, et al. Integrative genomic profiling of human prostate cancer. Cancer Cell. 2010; 18: 11-22.
- Brenner JC, Chinnaiyan AM. Disruptive events in the life of prostate cancer. Cancer Cell. 2011; 19: 301-303.
- Pflueger D, Terry S, Sboner A, Habegger L, Esgueva R, Lin PC, et al. Discovery of non-ETS gene fusions in human prostate cancer using next-generation RNA sequencing. Genome Res. 2011; 21: 56-67.
- Berger MF, Lawrence MS, Demichelis F, Drier Y, Cibulskis K, Sivachenko AY, et al. The genomic complexity of primary human prostate cancer. Nature. 2011; 470: 214-220.
- Barbieri CE, Baca SC, Lawrence MS, Demichelis F, Blattner M, Theurillat JP, et al. Exome sequencing identifies recurrent SPOP, FOXA1 and MED12 mutations in prostate cancer. Nat Genet. 2012; 44: 685-689.
- Network TCGA. The Molecular Taxonomy of Primary Prostate Cancer. Cell. 2015; 163: 1011-1025.
- Svensson MA, LaFargue CJ, MacDonald TY, Pflueger D, Kitabayashi N, Santa-Cruz AM, et al. Testing mutual exclusivity of ETS rearranged prostate cancer. Lab Invest. 2011; 91: 404-412.
- Tomlins SA, Bjartell A, Chinnaiyan AM, Jenster G, Nam RK, Rubin MA, et al. ETS gene fusions in prostate cancer: from discovery to daily clinical practice. Eur Urol. 2009; 56: 275-286.
- Rubin MA, Maher CA, Chinnaiyan AM. Common gene rearrangements in prostate cancer. J Clin Oncol. 2011; 29: 3659-3668.
- Park K, Tomlins SA, Mudaliar KM, Chiu YL, Esgueva R, Mehra R, et al. Antibody-based detection of ERG rearrangement-positive prostate cancer. Neoplasia. 2010; 12: 590-598.
- Garraway IP, Seligson D, Said J, Horvath S, Reiter RE. Trefoil factor 3 is overexpressed in human prostate cancer. Prostate. 2004; 61: 209-214.
- Faith DA, Isaacs WB, Morgan JD, Fedor HL, Hicks JL, Mangold LA, et al. Trefoil factor 3 overexpression in prostatic carcinoma: prognostic importance using tissue microarrays. Prostate. 2004; 61: 215-227.
- Terry S, Nicolaiew N, Basset V, Semprez F, Soyeux P, Maille P, et al. Clinical value of ERG, TFF3, and SPINK1 for molecular subtyping of prostate cancer. Cancer. 2015; 121: 1422-1430.
- Saal LH, Johansson P, Holm K, Gruvberger-Saal SK, She QB, Maurer M, et al. Poor prognosis in carcinoma is associated with a gene expression signature of aberrant PTEN tumor suppressor pathway activity. Proc Natl Acad Sci U S A. 2007; 104: 7564-7569.
- Shen MM, Abate-Shen C. Molecular genetics of prostate cancer: new prospects for old challenges. Genes Dev. 2010; 24: 1967-2000.
- Carver BS, Tran J, Gopalan A, Chen Z, Shaikh S, Carracedo A, et al. Aberrant ERG expression cooperates with loss of PTEN to promote cancer progression in the prostate. Nat Genet. 2009; 41: 619-624.
- King JC, Xu J, Wongvipat J, Hieronymus H, Carver BS, Leung DH, et al. Cooperativity of TMPRSS2-ERG with PI3-kinase pathway activation in prostate oncogenesis. Nat Genet. 2009; 41: 524-526.
- Demichelis F, Fall K, Perner S, Andren O, Schmidt F, Setlur SR, et al. TMPRSS2: ERG gene fusion associated with lethal prostate cancer in a watchful waiting cohort. Oncogene. 2007; 26: 4596-4599.
- Saramaki OR, Harjula AE, Martikainen PM, Vessella RL, Tammela TL, Visakorpi T. TMPRSS2: ERG fusion identifies a subgroup of prostate cancers with a favorable prognosis. Clin Cancer Res. 2008; 14: 3395-400.
- Hoogland AM, Jenster G, van Weerden WM, Trapman J, van der Kwast T, Roobol MJ, et al. ERG immunohistochemistry is not predictive for PSA recurrence, local recurrence or overall survival after radical prostatectomy for prostate cancer. Mod Pathol. 2012; 25: 471-479.
- FitzGerald LM, Agalliu I, Johnson K, Miller MA, Kwon EM, Hurtado-Coll A, et al. Association of TMPRSS2-ERG gene fusion with clinical characteristics and outcomes: results from a population-based study of prostate cancer. BMC Cancer. 2008; 8: 230.
- Garcia-Flores M, Casanova-Salas I, Rubio-Briones J, Calatrava A, Dominguez-Escrig J, Rubio L, et al. Clinico-pathological significance of the molecular alterations of the SPOP gene in prostate cancer. Eur J Cancer. 2014; 50: 2994-3002.
- Blattner M, Lee DJ, O'Reilly C, Park K, MacDonald TY, Khani F, et al. SPOP mutations in prostate cancer across demographically diverse patient cohorts. Neoplasia. 2014; 16: 14-20.
- Grupp K, Diebel F, Sirma H, Simon R, Breitmeyer K, Steurer S, et al. SPINK1 expression is tightly linked to 6q15- and 5q21-deleted ERG-fusion negative prostate cancers but unrelated to PSA recurrence. Prostate. 2013; 73: 1690-1698.
- Leinonen KA, Saramaki OR, Furusato B, Kimura T, Takahashi H, Egawa S, et al. Loss of PTEN is associated with aggressive behavior in ERG-positive prostate cancer. Cancer Epidemiol Biomarkers Prev. 2013; 22: 2333-2344.
- Ahearn TU, Pettersson A, Ebot EM, Gerke T, Graff RE, Morais CL, et al. A Prospective Investigation of PTEN Loss and ERG Expression in Lethal Prostate Cancer. J Natl Cancer Inst. 2016; 108.
- Rasanen K, Itkonen O, Koistinen H, Stenman UH. Emerging Roles of SPINK1 in Cancer. Clin Chem. 2016; 62: 449-457.
- Tomlins SA, Rhodes DR, Yu J, Varambally S, Mehra R, Perner S, et al. The role of SPINK1 in ETS rearrangement-negative prostate cancers. Cancer Cell. 2008; 13: 519-528.
- Smith SC, Tomlins SA. Prostate cancer SubtyPINg biomarKers and outcome: is clarity emERGing? Clinical Cancer Research. 2014; 20: 4733-4736.
- Flavin R, Pettersson A, Hendrickson WK, Fiorentino M, Finn S, Kunz L, et al. SPINK1 protein expression and prostate cancer progression. Clinical Cancer Research. 2014; 20: 4904-4911.
- Tomlins SA, Laxman B, Varambally S, Cao X, Yu J, Helgeson BE, et al. Role of the TMPRSS2-ERG gene fusion in prostate cancer. Neoplasia. 2008; 10: 177-188.
- Rickman DS, Chen YB, Banerjee S, Pan Y, Yu J, Vuong T, et al. ERG cooperates with androgen receptor in regulating trefoil factor 3 in prostate cancer disease progression. Neoplasia. 2010; 12: 1031-1040.
- Ploussard G, Terry S, Maille P, Allory Y, Sirab N, Kheuang L, et al. Class III beta-tubulin expression predicts prostate tumor aggressiveness and patient response to docetaxel-based chemotherapy. Cancer Res. 2010; 70: 9253-9264.
- Tsourlakis MC, Weigand P, Grupp K, Kluth M, Steurer S, Schlomm T, et al. βIII-tubulin overexpression is an independent predictor of prostate cancer progression tightly linked to ERG fusion status and PTEN deletion. Am J Pathol. 2014; 184: 609-617.
- Terry S, Ploussard G, Allory Y, Nicolaiew N, Boissiere-Michot F, Maille P, et al. Increased expression of class III beta-tubulin in castration-resistant human prostate cancer. Br J Cancer. 2009; 101: 951-956.
- Terry S, Maille P, Baaddi H, Kheuang L, Soyeux P, Nicolaiew N, et al. Cross modulation between the androgen receptor axis and protocadherin-PC in mediating neuroendocrine transdifferentiation and therapeutic resistance of prostate cancer. Neoplasia. 2013; 15: 761-772.
- Varambally S, Dhanasekaran SM, Zhou M, Barrette TR, Kumar-Sinha C, Sanda MG, et al. The polycomb group protein EZH2 is involved in progression of prostate cancer. Nature. 2002; 419: 624-629.
- Bachmann IM, Halvorsen OJ, Collett K, Stefansson IM, Straume O, Haukaas SA, et al. EZH2 expression is associated with high proliferation rate and aggressive tumor subgroups in cutaneous melanoma and cancers of the endometrium, prostate, and breast. J Clin Oncol. 2006; 24: 268-273.
- Bryant RJ, Cross NA, Eaton CL, Hamdy FC, Cunliffe VT. EZH2 promotes proliferation and invasiveness of prostate cancer cells. Prostate. 2007; 67: 547-556.
- Melling N, Thomsen E, Tsourlakis MC, Kluth M, Hube-Magg C, Minner S, et al. Overexpression of enhancer of zeste homolog 2 (EZH2) characterizes an aggressive subset of prostate cancers and predicts patient prognosis independently from pre- and postoperatively assessed clinicopathological parameters. Carcinogenesis. 2015; 36: 1333-1340.
- Beltran H, Rickman DS, Park K, Chae SS, Sboner A, MacDonald TY, et al. Molecular characterization of neuroendocrine prostate cancer and identification of new drug targets. Cancer Discov. 2011; 1: 487-495.
- Beltran H, Prandi D, Mosquera JM, Benelli M, Puca L, Cyrta J, et al. Divergent clonal evolution of castration-resistant neuroendocrine prostate cancer. Nat Med. 2016; 22: 298-305.
- Roychowdhury S, Chinnaiyan AM. Advancing precision medicine for prostate cancer through genomics. J Clin Oncol. 2013; 31: 1866-1873.
- Rubin MA. Toward a prostate cancer precision medicine. Urol Oncol. 2015; 33: 73-74.
- Koh CM, Bieberich CJ, Dang CV, Nelson WG, Yegnasubramanian S, De Marzo AM. MYC and Prostate Cancer. Genes Cancer. 2010; 1: 617-628.
- Baca SC, Prandi D, Lawrence MS, Mosquera JM, Romanel A, Drier Y, et al. Punctuated evolution of prostate cancer genomes. Cell. 2013; 153: 666-677.
- Baena E, Shao Z, Linn DE, Glass K, Hamblen MJ, Fujiwara Y, et al. ETV1 directs androgen metabolism and confers aggressive prostate cancer in targeted mice and patients. Genes Dev. 2013; 27: 683-698.
- Boysen G, Barbieri CE, Prandi D, Blattner M, Chae SS, Dahija A, et al. SPOP mutation leads to genomic instability in prostate cancer. Elife. 2015; 4.
- Cerami E, Gao J, Dogrusoz U, Gross BE, Sumer SO, Aksoy BA, et al. The cBio cancer genomics portal: an open platform for exploring multidimensional cancer genomics data. Cancer Discov. 2012; 2: 401-404.
- Han B, Mehra R, Lonigro RJ, Wang L, Suleman K, Menon A, et al. Fluorescence in situ hybridization study shows association of PTEN deletion with ERG rearrangement during prostate cancer progression. Mod Pathol. 2009; 22: 1083-1093.
- Bismar TA, Yoshimoto M, Vollmer RT, Duan Q, Firszt M, Corcos J, et al. PTEN genomic deletion is an early event associated with ERG gene rearrangements in prostate cancer. BJU Int. 2011; 107: 477-485.
- Nordin A, Wang W, Welen K, Damber JE. Midkine is associated with neuroendocrine differentiation in castration-resistant prostate cancer. Prostate. 2013; 73: 657-667.
- Barbieri CE, Rubin MA. Genomic rearrangements in prostate cancer. Curr Opin Urol. 2015; 25: 71-76.
- Falchook GS, Bastida CC, Kurzrock R. Aurora Kinase Inhibitors in Oncology Clinical Trials: Current State of the Progress. Semin Oncol. 2015; 42: 832-848.
- Frankel AE, Liu X, Minna JD. Developing EZH2-Targeted Therapy for Lung Cancer. Cancer Discov. 2016; 6: 949-952.
- Lens SM, Voest EE, Medema RH. Shared and separate functions of polo-like kinases and aurora kinases in cancer. Nat Rev Cancer. 2010; 10: 825-841.
- Terry S, Beltran H. The many faces of neuroendocrine differentiation in prostate cancer progression. Front Oncol. 2014; 4: 60.
- Vlachostergios PJ, Papandreou CN. Targeting neuroendocrine prostate cancer: molecular and clinical perspectives. Front Oncol. 2015; 5: 6.

